Example proportional maps
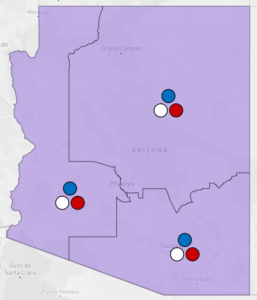
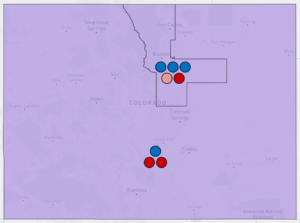
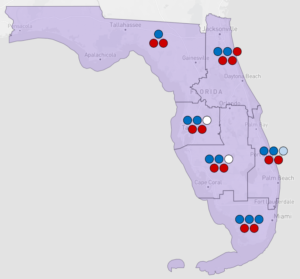
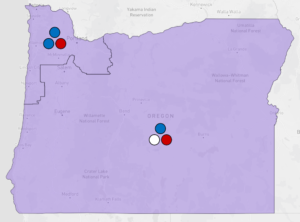
With proportional ranked choice voting, instead of living in a district with a single representative, you will be part of a larger region that elects a small delegation of representatives. Each representative in the delegation would be elected by a distinct group of voters within the region, so the delegation as a whole would proportionally represent the diversity of the voters as a whole. Depending on where you live, your state may elect all of its representatives statewide, or it may divide into a few multi-winner districts that each elect three or more representatives. To visualize what that might look like, the below maps roughly follow the criteria used by the Fair Representation Act.
These are not the exact maps that would be adopted under the Fair Representation Act. They are demonstrations that show about how big multi-winner districts tend to be, and they use presidential voting data to show about how many seats could be won by voters that prefer Democrats and those that prefer Republicans in each.
For each map, you can click on the image for a higher resolution version, and you can click on the tables showing partisan and racial projections for each district for more data. The two links below also include links to these maps on Dave’s Redistricting App, alternative versions for some states, and other information.
|
Alabama |
Arizona |
|
California |
Colorado |
|
Florida |
Georgia |
|
Illinois |
Indiana |
|
Kentucky |
Louisiana |
|
Massachusetts |
Maryland |
|
Michigan |
Minnesota |
|
Missouri |
North Carolina |
|
New Jersey |
New York |
|
Ohio |
Oregon |
|
Pennsylvania |
South Carolina |
|
Tennessee |
Texas |
|
Virginia |
Washington |
|
Wisconsin |
Nation |


