Partisan representation is not full or fair
In winner-take-all elections, one group of voters effectively elects a representative, while all other voters in the district cast “wasted votes.” In aggregate, nearly two-thirds of votes cast are wasted.
The large proportion of wasted votes makes gerrymandering easy and effective. One party can be “packed” into a small number of districts or “cracked” across many, putting them at an unfair disadvantage.
Single-winner districts systematically disfavor parties that do well in cities. Currently, that means that the system disadvantages Democrats even in the absence of intentional gerrymandering.
On November 6, 2012, voters reelected Democratic President Barack Obama and increased the Democratic majority in the U.S. Senate by two seats. A clear majority of voters also preferred Democrats in the U.S. House of Representatives, but in that case, the minority of voters who voted for Republicans won a comfortable majority of seats: 234 to Democrats’ 201.
That a minority of votes can earn a majority of seats demonstrates a simple fact: Some votes count more than others. In the vernacular of political science, some votes are effective, while others are wasted. In 2012, a lot more Democratic votes were wasted than votes for Republicans, making Republican votes more efficient than Democratic votes. That, in turn, meant that Republicans could earn more seats with fewer votes.
A winner-take-all system for electing a legislative body always wastes a large number of votes. And wasted votes rarely fall equally on Democrats and Republicans. Which party is more harmed depends entirely on how the districts are drawn. This chapter addresses why winner-take-all systems waste so many votes, as well as why this fact tends to advantage one party while creating powerful incentives for the corrupt practice of intentional gerrymandering.
Wasted votes
The natural consequence of winner-take-all voting is that, as its name suggests, everyone who is not a winner takes nothing. In every single-winner district, one group of voters effectively elects the winner; every other group’s votes are wasted. This system wastes far more votes than proportional systems.
Those who vote for losing candidates have a weak kind of representation. Their representative may spend every day opposing everything they believe in. They may align better with representatives in other districts, but those representatives are not accountable to them; representatives do not work for people outside of their districts, no matter how similar their policy views.[1]
Just under 70 million eligible voters – 28 percent of eligible voters – live in districts that are safe for the political party they oppose.[2] These unfortunate citizens are represented in Congress, but their representative does not legislate in their political interests. They have the right to vote, but the nature of their district means that their vote has little influence.
Winner-take-all politics has split our country into “red” and “blue” America. This robs us of the diversity of ideas and interests that exist across all regions of the country. Massachusetts, for example, is a blue state. In 2020, all nine of its congressional districts were safely Democratic. Yet across those districts, 1.2 million people backed Donald Trump for president. Likewise, the band of states running up the center of the country, consisting of Oklahoma, Kansas, Nebraska, and the Dakotas, elected a combined 14 representatives, 13 of which were Republicans. Yet across those 13 Republican districts, 1.5 million people wanted Joe Biden to be president.
Our country is more politically sorted than it has been for a century, but we are not nearly as sorted as the simple narrative suggests. Liberal voters live in the reddest parts of rural America, and conservative voters live in the bluest of cities. However, they are invisible in winner-take-all elections. Every vote they cast fails to elect anyone. In a proportional system, their votes would help elect a proportional number of winners; for example, one or two of the winners in a five-winner district. In winner-take-all, they are merely symbolic gestures.
Voters who vote for winning candidates aren’t much better off. They may be more likely to support their representative, but unless they live in the rare competitive district, their representative did not need their vote to win. That is, their vote does not “count” very much at all.
In a safe Democratic district, votes for the winning Democrat (in excess of the 50% needed to win) are just as symbolic as votes for the losing Republican, and vice versa in safe Republican districts. In fact, if the winning candidate earns a lot more votes than needed to win, then their voters were “packed” into a single district, and could have been more effective if spread among several. Packing makes it possible for a statewide or national party to win a majority of votes but only a minority of seats.
These are the two kinds of wasted votes: those cast for losing candidates and those cast for the winning candidate that exceed those needed to win. The proportion of effective votes — those not wasted — serves as an approximation of each vote’s power. Effective votes are those that the winner needed to win: If most votes are effective, then votes are powerful. If most votes are wasted, then votes are weak.
The number of effective votes in any given contest is simply the number of votes earned by the second-place candidate, plus one. That is all the winning candidate needed to win, so all other votes were wasted.
By this definition, about 64 percent of votes cast in congressional races in 2020 were wasted.[3] That does not mean they were meaningless; there are many good reasons to vote, even in safe elections. But it does mean that the victor did not need them to win, which, in turn, means that elected members of Congress are not all that accountable to their voters.
Gerrymandering
In 2017, Democrat Doug Jones won a surprising statewide victory for U.S. Senate against Republican Roy Moore in Alabama. With a victory margin of 1.5 percent, Jones earned about 20,000 more votes than Moore. Yet Jones beat Moore in only one of the state’s seven congressional districts. He won by a landslide in one district and lost by a smaller amount in the other six. Had the exact same votes been cast district-by-district for Republican and Democratic congressional nominees, Republicans would have won all but one (86 percent) of Alabama’s seats with less than half (48 percent) of the vote.
Alabama 2017 special election results by congressional district
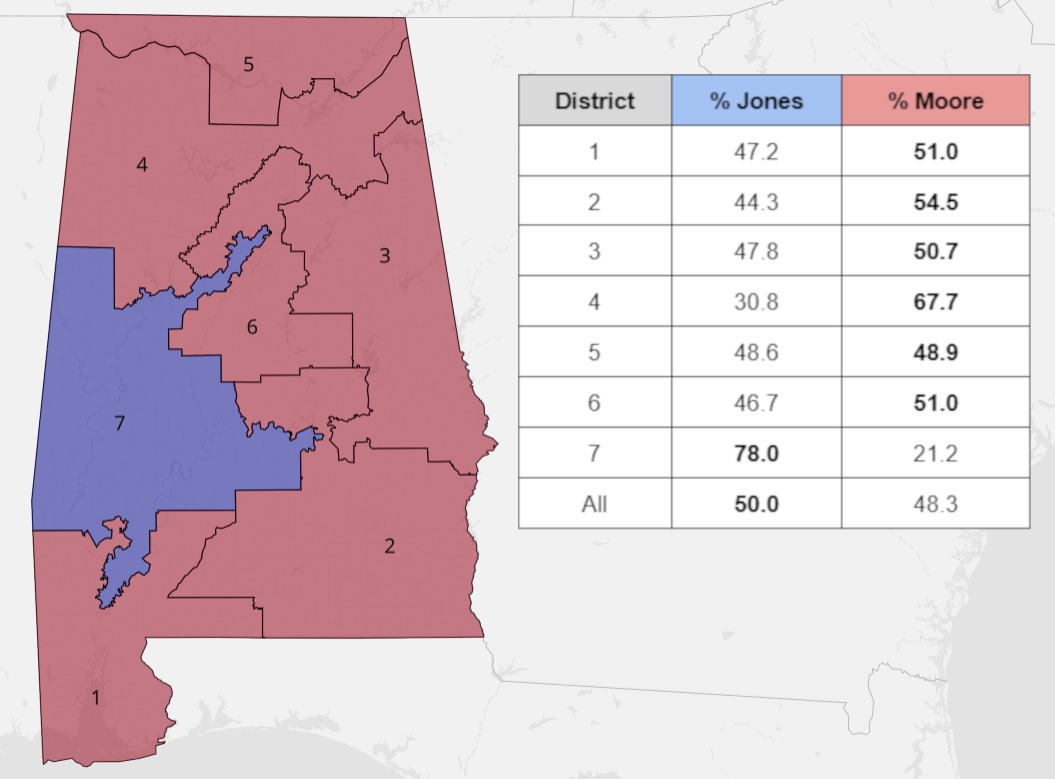
The keys to such lopsided outcomes are packing and cracking. Jones could win a majority of the state’s votes and yet only win a single congressional district because Alabama’s Democratic voters were packed into one district. In congressional elections, a lot of Democratic votes are wasted on sure bets. Alabama’s remaining Democratic vote was then cracked among the six other districts, kept low enough to ensure that all those votes would be wasted on likely losers. Republican votes were far more efficient: Few Republican votes were wasted in the sole Democratic district, and there were just enough to ensure victory in each of the other six.
Packing and cracking are evident when one party’s candidates consistently win between 55 and 65 percent of the vote while candidates for the other major party win fewer districts but with higher takes (more than 75 percent of the vote each).
This brings us to gerrymandering. The term comes from Elbridge Gerry, who signed a district plan into law in 1812 while governor of Massachusetts that included one district shaped like a salamander, as envisioned by the famous cartoon mocking the distorted result. The district was termed the “Gerry-mander,” a term that stuck for the corrupt practice of using district lines to manipulate election outcomes, especially when used to favor one political party over another.
This strategy has been with us since the country’s early history, but it took on new significance during the 2010 redistricting cycle. That year, the Redistricting Majority Project, or “REDMAP,” a project of the Republican State Leadership Committee (a group that promotes Republican candidates at all levels of government), strategically targeted state legislative elections in closely divided states where the state legislature could control the upcoming decennial redistricting process. Their targets included Michigan, North Carolina, Ohio, Pennsylvania, and Wisconsin.[4]
The 2010 elections favored Republicans, and Republicans won control over redistricting in all those states. After the 2010 census results came in, the new Republican-controlled legislatures aggressively gerrymandered these states, creating what FairVote, a nonprofit organization seeking better elections, called the “worst congressional map ever.” These powerful gerrymanders enabled Republicans to increase their congressional majority two years later even though public sentiment had swung back to Democrats, who collectively won more votes.
Partisan skews also exist in the absence of extreme intentional gerrymandering. Even in the 2012 elections, intentional gerrymandering accounted for only about half of the GOP’s advantage. In fact, analysis of voter preferences going back to 1996 shows three other election years in which national partisanship favored Democrats yet Republicans won a majority of seats.
Partisan preference and election result by year
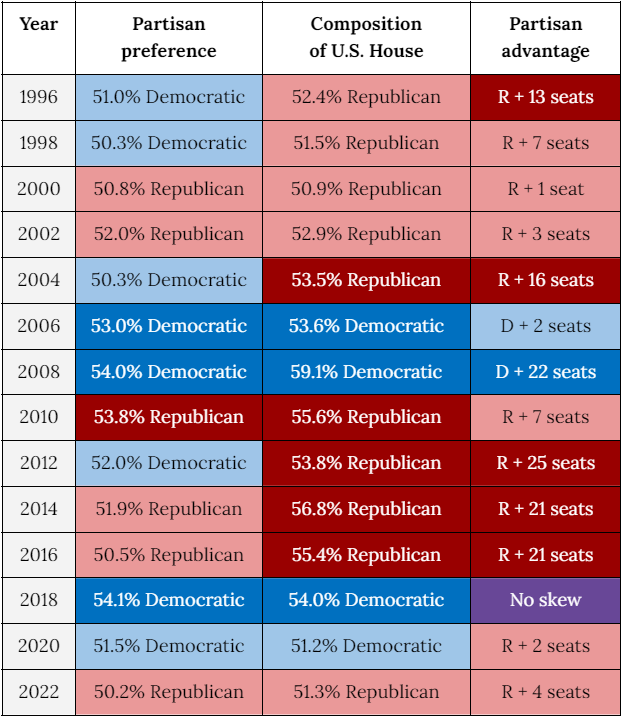
Conventional wisdom holds that in a single-winner district system, the party that wins the most votes receives a “winner’s bonus,” earning a larger share of seats than votes. Yet as Table 1 demonstrates, Democrats were favored in a majority of the past 13 election years, but Republicans earned the “bonus” seats in 11 of 14 cycles. In short, the single-winner district system used to elect the U.S. House does not favor the party that earns the most support; rather, it systematically favors Republicans.[5]
In his book Why Cities Lose: The Deep Roots of the Urban-Rural Divide, political scientist Jonathan Rodden demonstrates that under conditions of urban-rural polarization, single-winner district elections systematically disfavor parties with urban support with or without intentional gerrymandering. The dynamic plays out across several countries that use the system, including the United States, the United Kingdom, Canada, and Australia. In all such cases, the left-of-center political party favored by urban voters consistently faces a disadvantage in legislative elections. When they do win majorities, they typically do so by courting suburban voters, and diluting their own pro-urban platforms in the process. The rural-favored party, on the other hand, need not make any such concessions to win a legislative majority, which it can do even in years when most voters vote against it.
The reason rural and suburban parties win even when they lose goes back to the principles of packing and cracking. Cities house a lot of people, all of whom live in urban settings. Suburbs and rural countryside, on the other hand, are geographically larger and have smaller urban bits within them. Urban interests, then, are naturally packed into cities and then cracked in suburban and rural areas. In today’s United States, Democrats often win cities and Republicans often win the countryside, but Democrats waste a lot more votes in the cities than Republicans do outside of them.
Pennsylvania provides a helpful case study on the relative impact of gerrymandering versus urban-rural asymmetry. An evenly divided state, Pennsylvania was, from 2012 to 2018, among the most gerrymandered states in the nation and among the states targeted by REDMAP. However, in 2018, opponents of gerrymandering won a key legal victory: The Pennsylvania Supreme Court ruled that the gerrymander violated Pennsylvania’s Constitution and ordered a new map to be adopted.
Republicans were livid. They tried fighting back in court, refusing to comply, and even testing the idea of impeaching the Democratic judges who issued the order. The chair of the Pennsylvania Republican Party called the new map “partisan gerrymandering and a blatant power grab.”[6] It even earned an angry tweet from Trump himself.
Yet the new map could not fairly be called a Democratic gerrymander. It did not favor Democrats, nor was it evenly balanced between the two parties: It favored Republicans, just not as much as they wanted. The statistical website www.FiveThirtyEight.com predicted Democrats would win only 7.5 of the state’s 18 U.S. House seats over the long term.[7] PlanScore, which applies various mathematical models to district maps to assess their fairness, assessed the Pennsylvania map as having a slight Republican bias across three different measures.
Why did a map drawn specifically to neutralize gerrymandering still have a bias in favor of Republicans? In Pennsylvania, as in much of the country, Democratic voters disproportionately live in a small number of urban areas, particularly in Philadelphia. One could theoretically adopt a balanced single-winner district map in Pennsylvania, but only by artificially carving up Philadelphia among several tentacle-like districts.
Full and fair representation
Under single-winner districts, the district map fundamentally decides who wins and who loses. Our votes are diluted, with a majority going to candidates who don’t need them. Who wins the power to legislate depends more on the district map than on any other factor, be it campaign strategy or voter turnout. Understanding this, political parties use more resources to influence district maps than to court and serve voters.
That so many votes are wasted shows the winner-take-all system’s failure to achieve full representation, which requires that every vote be effective, or as close to it as practicable. Yet under winner-take-all, not even a majority of votes cast are effective.
That districts favor some groups over others demonstrates the failure of winner-take-all to achieve fair representation across the jurisdiction, which requires that a majority of votes always elect a majority of seats and that the share of seats won matches the share of votes cast. Under winner-take-all, some votes are worth more than others, privileging those votes at the expense of voter equality.
These failures are not only theoretical; they have real-world effects. When fewer votes are effective, those in power are less accountable to those they ostensibly represent. This opens the door to corruption, not only in the form of gerrymandering but in the whole project of governance. When votes are not equal, those in power naturally serve some interests more than others, undermining the very purpose of democracy.
It is not enough to end intentional gerrymandering. We deserve a system that ensures full and fair representation. To do that, we need proportional representation.
Notes
[1] See, e.g., Joseph Fishkin, Taking Virtual Representation Seriously, 59 W.M. L. Rev. 1681, at 1697 n.46 (2018) (Relaying that, anecdotally, many people in one of the Republican-held districts in the city of Austin believe they are represented by a Democrat, but upon reaching out to ‘their’ Democratic representative, are redirected to their actual representative).
[2] Drew Penrose, FairVote, Uncompetitive and unrepresented: Voters locked out of representation, https://www.fairvote.org/uncompetitive_and_unrepresented_voters_locked_out_of_representation.
[3] This metric ignores the impact that winner-take-all elections have on voter turnout and on disenfranchisement. Arguably, a more meaningful metric would be the number of effective votes divided by the total number of citizens of voting age.
[4] The project targeted 16 states total, but the impact was clearest in the swing states listed here. Daley, David, Inside the Republican Plot for Permanent Minority Rule, The New Republic (October 15, 2020).
[5] After the 2022 election, it was reported that Republicans were underrepresented compared to their share of the popular vote in congressional districts. E.g., Nate Cohn, 2022 Review: How Republicans Lost Despite Winning the Popular Vote, N.Y. Times, Dec. 13, 2022, https://www.nytimes.com/2022/12/13/upshot/2022-republicans-midterms-analysis.html. Overall, Republicans did win the raw vote by a substantial margin, but raw vote totals by party can be influenced by many factors aside from national partisan preference, such as uncontested races, intraparty races, or disparities in district type held by incumbents from each party. The measure above helps to control for these, and instead of measuring raw votes, it measures overperformance compared to a baseline of district partisanship from the prior presidential election. Other measures remain useful for various purposes, such as assessing performance in different kinds of districts, but the above measure is a reliable one for assessing the overall, national two-party preference.
[6] Alicia Victoria Lozano, NBC Philadelphia, Pennsylvania Court Issues New Congressional Map, https://www.nbcphiladelphia.com/news/national-international/pennsylvania-awaits-first-look-at-congressional-map/204775/ (Feb. 19, 2018).
[7] Aaron Bycoffe, FiveThirtyEight, Pennsylvania’s New Map Helps Democrats. But It’s Not A Democratic Gerrymander, https://fivethirtyeight.com/features/pennsylvanias-new-map-helps-democrats-but-its-not-a-democratic-gerrymander/ (Feb. 20, 2018).